
Categories
Market UpdatePublished October 5, 2026
Salt Lake County Housing Market Update, October 5th 2026
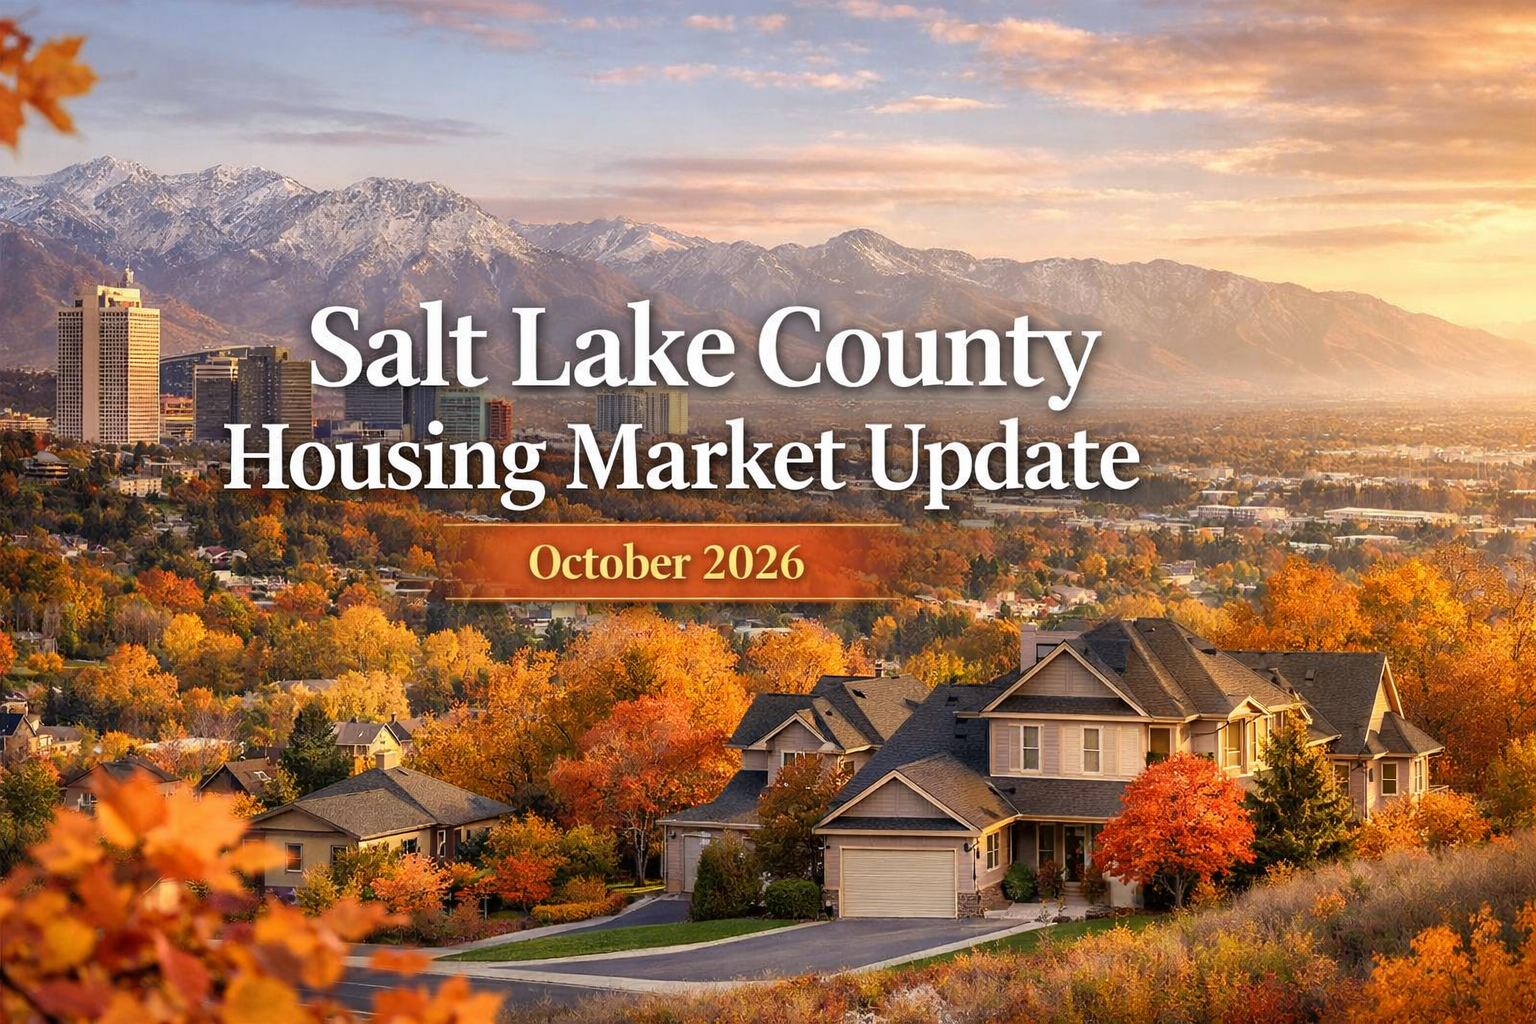
Salt Lake County Market Update | October 5, 2026
Quick answer:
Salt Lake County buyers still have room to compare homes and negotiate, but well-priced properties are moving.
The latest AreaPro report shows 3.8 months of inventory, 4,318 active listings, and 744 pending sales. Pending listings slipped from 814 last week, suggesting demand has cooled slightly while the supply picture has remained steady.
This is a market snapshot, not a week-over-week trendline.
Salt Lake County Market at a Glance
- 4,318 active listings
- 744 pending sales
- 6,750 sales in the last six months, or about 1,125 sales per month
- 3.8 months of inventory at the recent sales pace
- 57 average days on market for sold properties
- 78 average days on market for active listings
- $671,186 average sold price
- $725,975 average active asking price
- Sold properties closed at an average of 99.0% of their final list price
What Does 3.8 Months of Inventory Mean?
Months of inventory measures supply against demand. At the recent pace of sales, it would take about 3.8 months to sell the homes currently listed if no new homes came on the market.
That does not mean every home will take 3.8 months to sell. Price, condition, location, and property type still make a major difference.
What This Means for Buyers
The gap between 4,318 active listings and 744 pending homes suggests buyers have choices to sort through. You may have time to compare properties, evaluate condition, and look closely at pricing.
Still, countywide averages do not guarantee a discount on every offer. Well-priced homes in desirable locations can attract attention quickly.
The reported 99.0% sale-to-list-price figure compares the final asking price with the eventual sale price. A home’s price may have changed before that final listing price was set, so it should not be treated as a universal negotiation benchmark.
What This Means for Sellers
The 57-day average for sold homes is a useful planning point, not a deadline. Meanwhile, the 78-day average among active listings is a reminder that some homes are taking longer to sell.
A strong launch price, thoughtful preparation, and effective presentation still matter.
The average active asking price of $725,975 is higher than the average sold price of $671,186, but these figures represent different groups of properties. Subtracting one from the other does not measure the discount sellers accepted.
Planning Your Next Move
Countywide numbers help set the scene, but your best strategy depends on your neighborhood, price range, property type, and current competition.
If you’re planning to buy or sell, the next step is to compare recent sales and active listings in your specific area. That local view will help determine what to offer, how to price, and how to position your move.
Source: AreaPro Real Estate Market Overview, Salt Lake County, Utah, Total Market, all property types, six-month sold period. Market data as of October 2, 2026. Figures are countywide averages and counts, not a forecast.
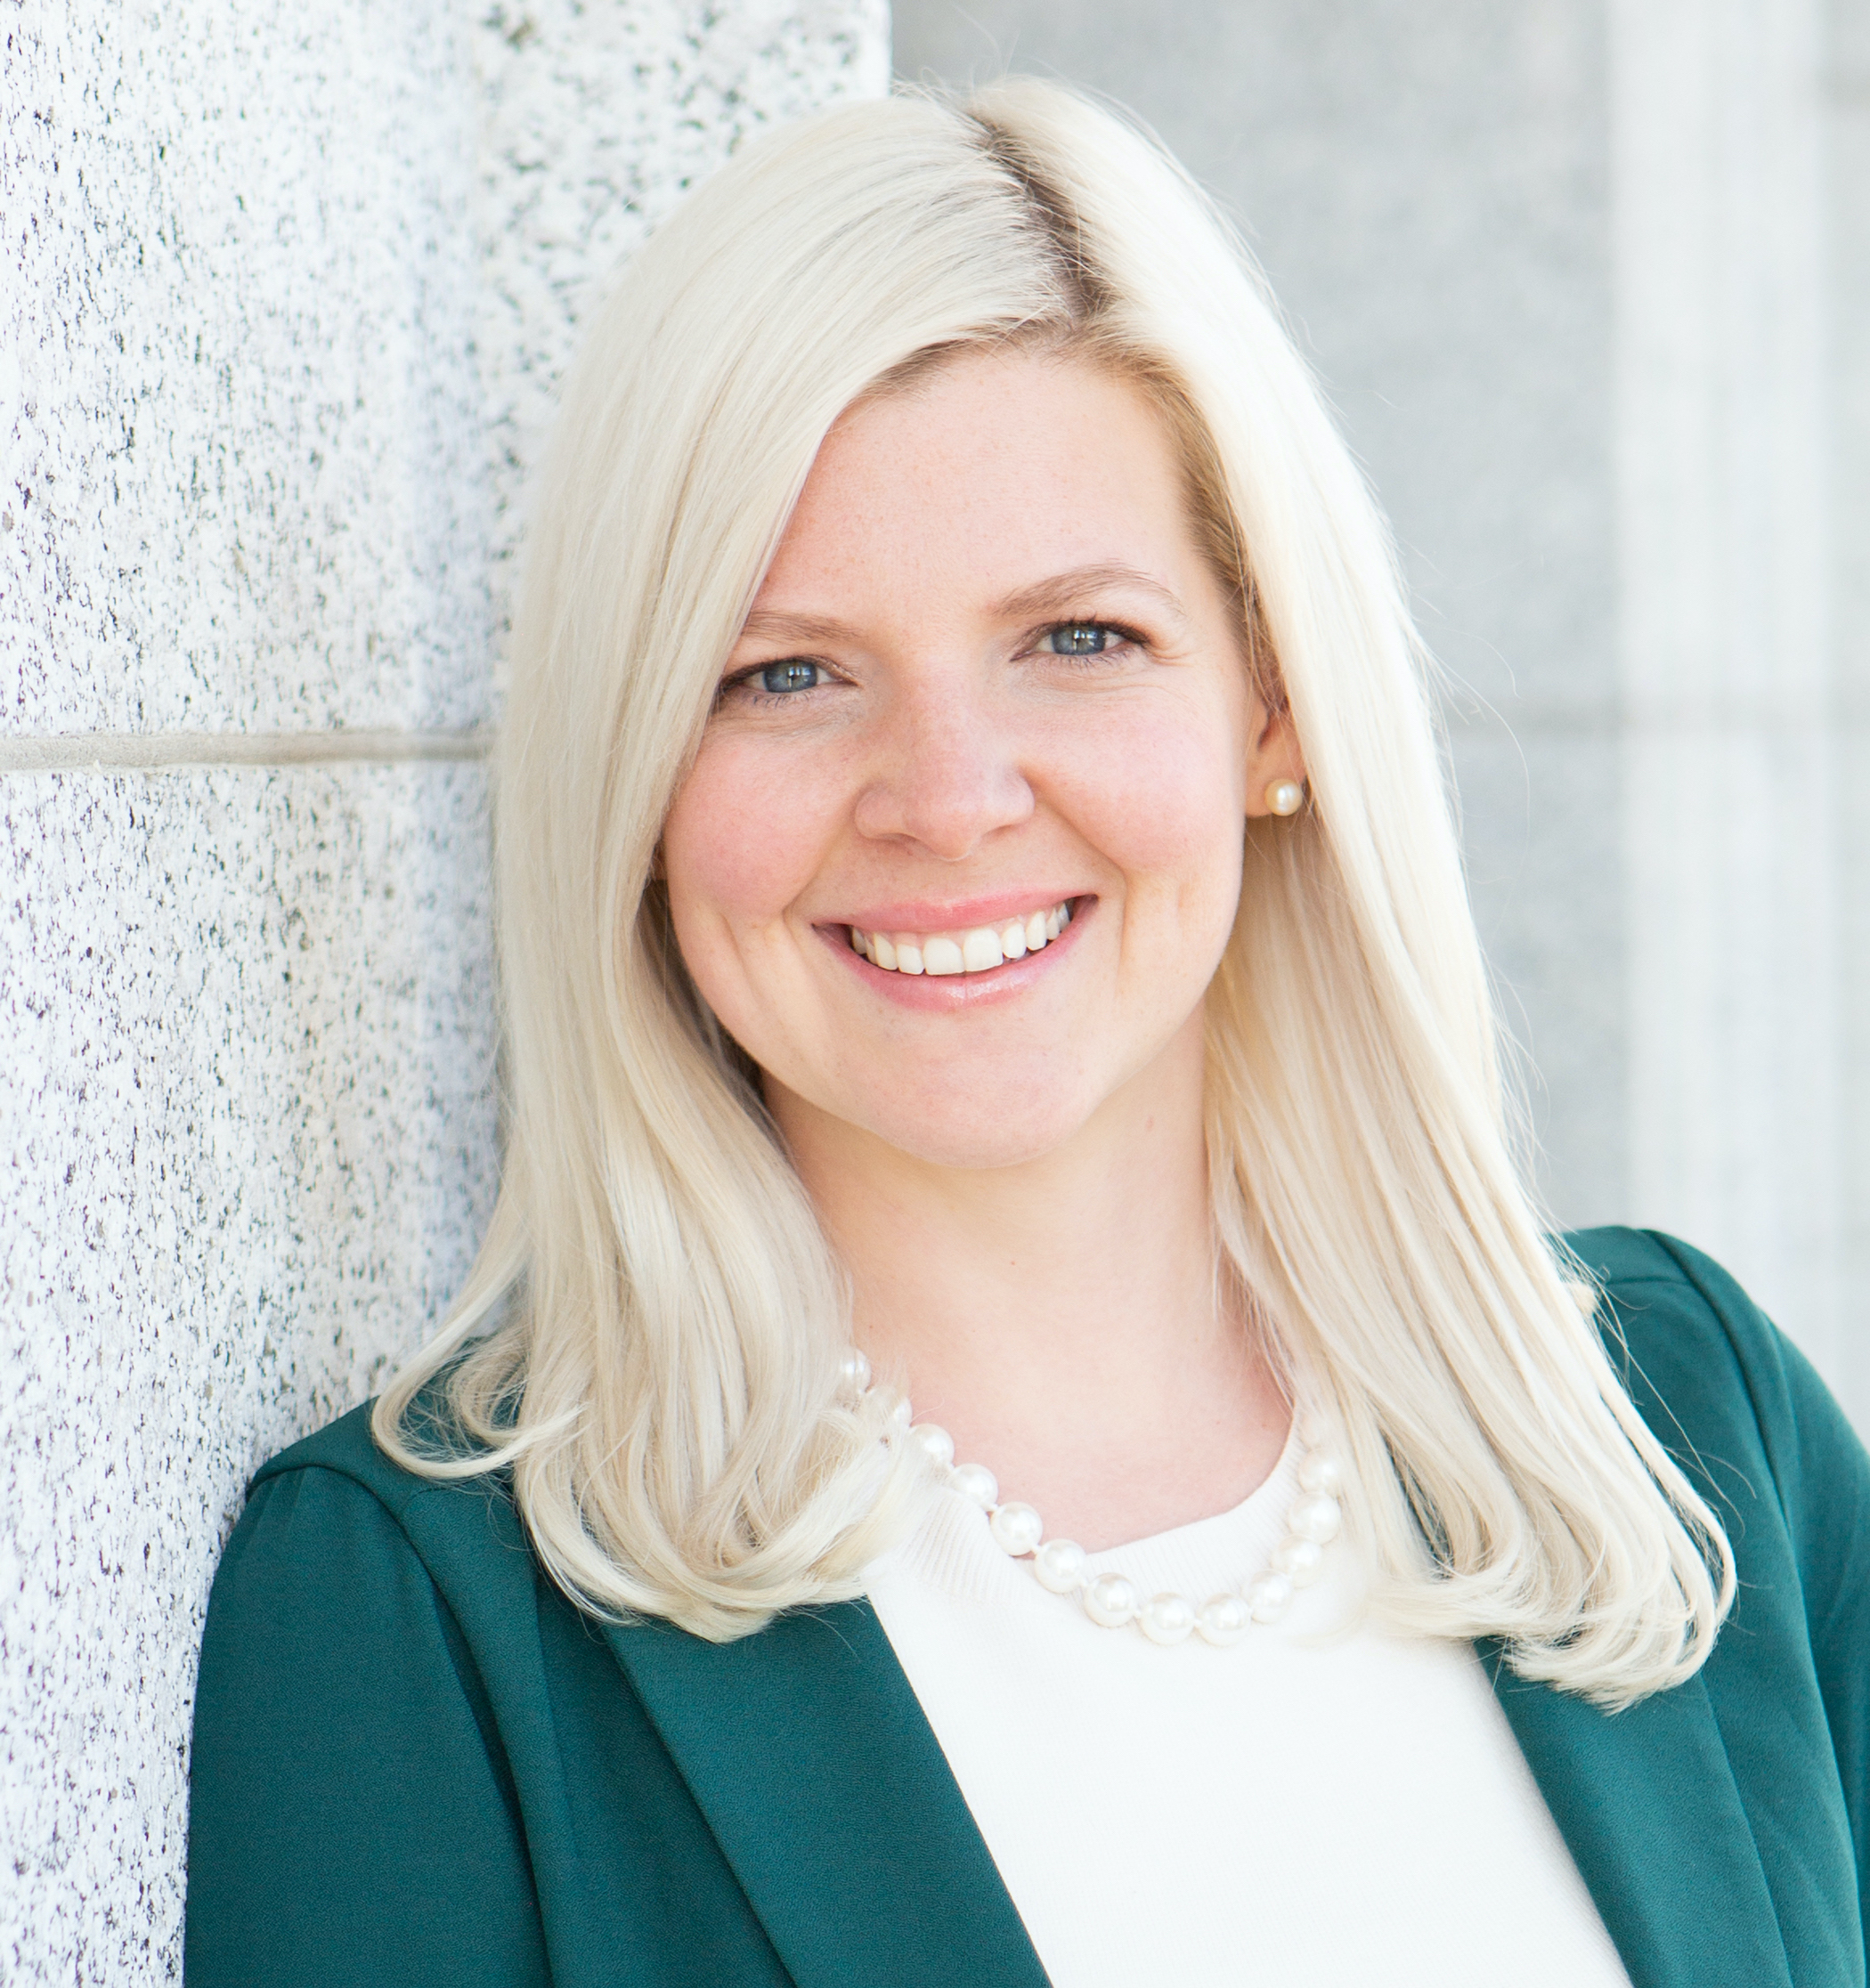
Emily Hayes
CEO Emily Hayes Homes | Emily Hayes Homes | Keller Williams | PLACE
or another way